
|
The size of node represents the occurrence frequency of the keyword, and the link size or color represents the co-occurrence of the keyword pair.
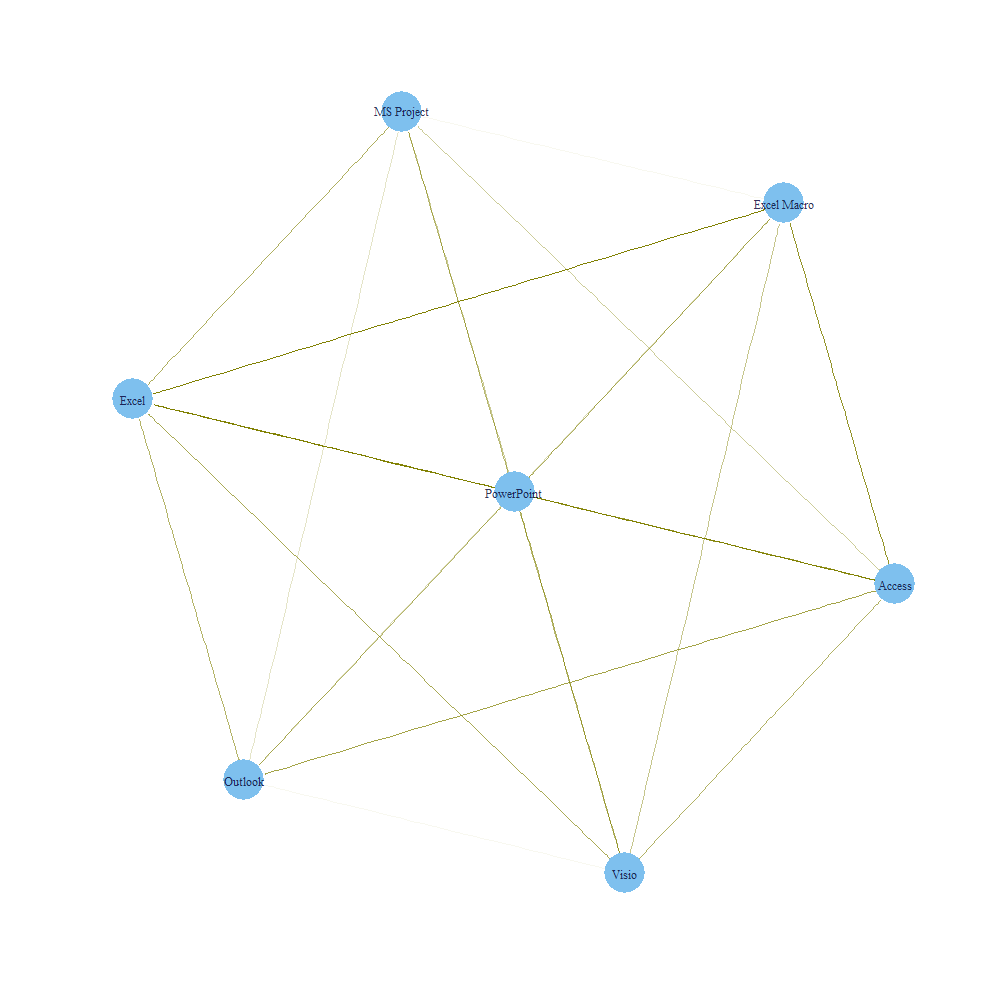
The size of node represents the occurrence frequency of the keyword, and the link size or color represents the co-occurrence of the keyword pair.
|

The size of node represents the occurrence frequency of the keyword, and the link size or color represents the co-occurrence of the keyword pair.
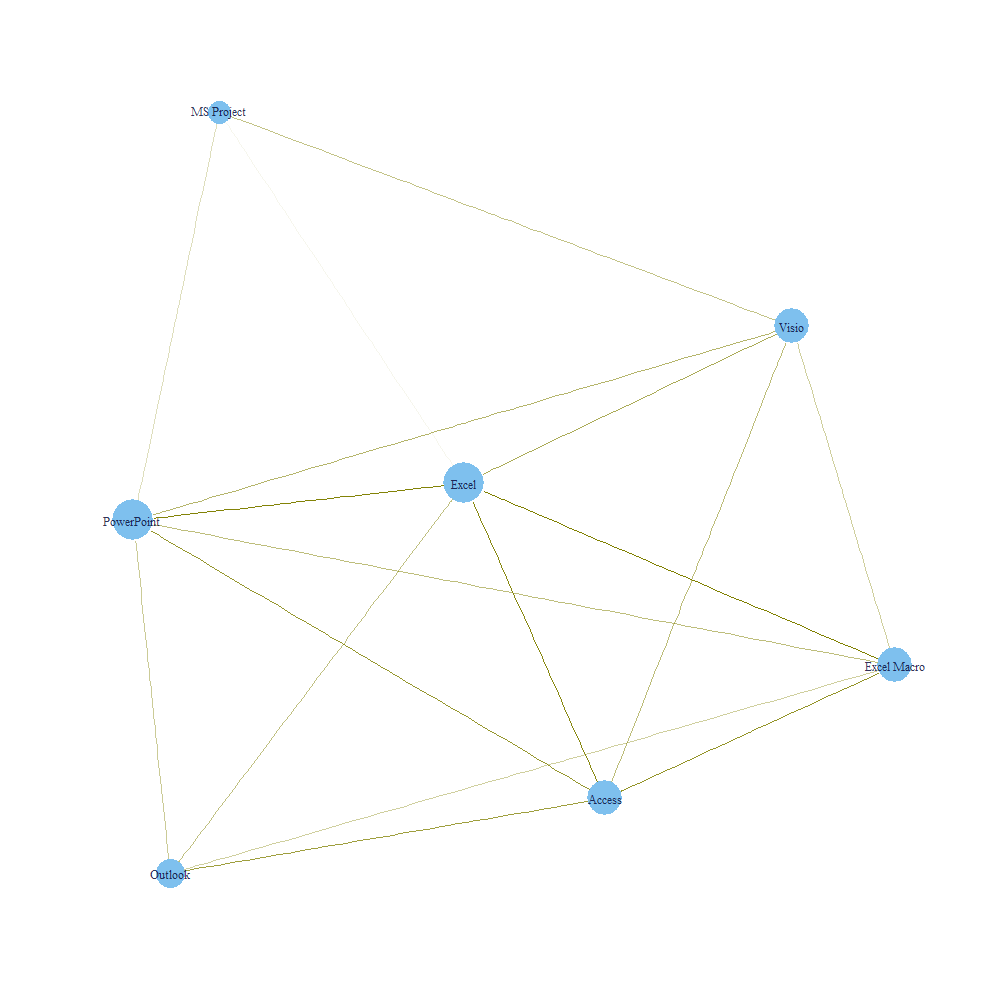
The size of node represents the occurrence frequency of the keyword, and the link size or color represents the co-occurrence of the keyword pair.
Created by Mr. Cyrus Wong, Data Scientist.
For update, please join the IVE - Information Technology Facebook page.
For technical explanation, please join the Report Facebook page.
For discussion, please join my facebook group or linkedin me.
Sponsored by:
![]()


supported by AWS in Education Grant award