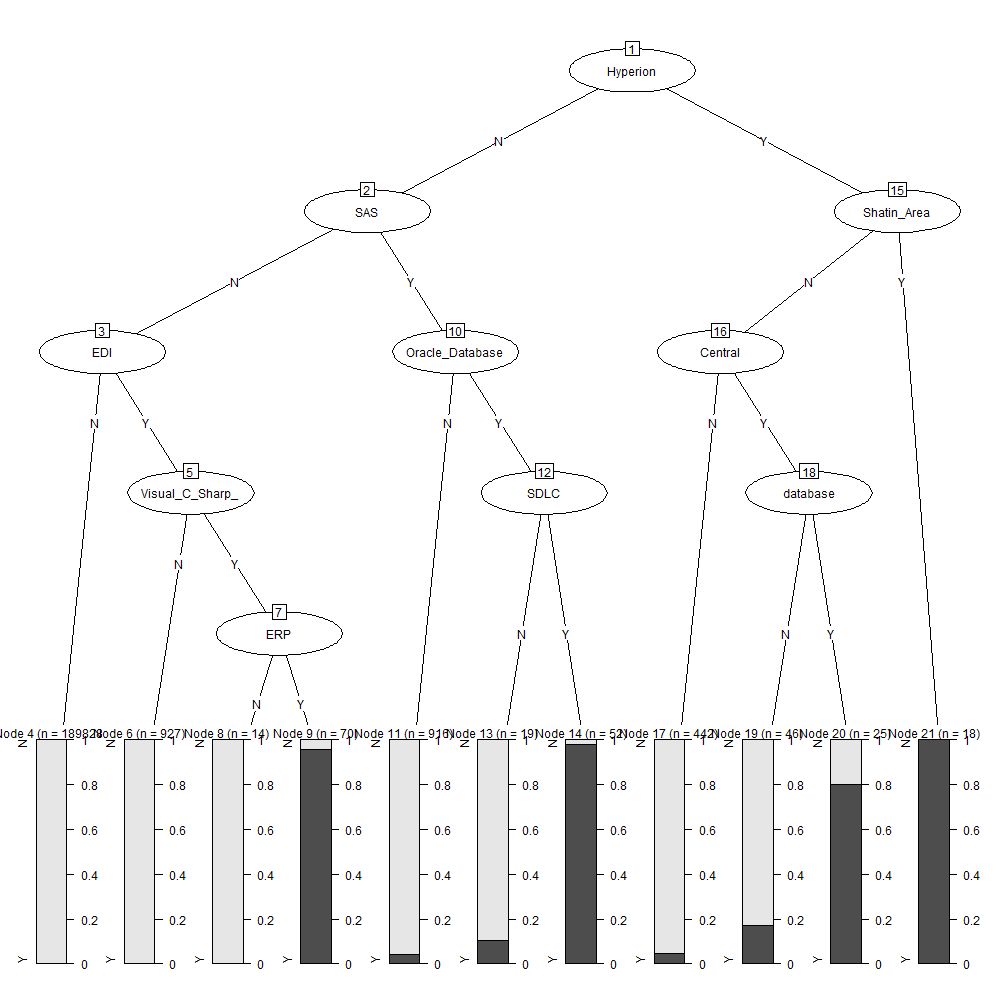
[1] root
| [2] Hyperion in N
| | [3] SAS in N
| | | [4] EDI in N: N (n = 189828, err = 0.2%)
| | | [5] EDI in Y
| | | | [6] Visual_C_Sharp_ in N: N (n = 927, err = 0.4%)
| | | | [7] Visual_C_Sharp_ in Y
| | | | | [8] ERP in N: N (n = 14, err = 0.0%)
| | | | | [9] ERP in Y: Y (n = 70, err = 4.3%)
| | [10] SAS in Y
| | | [11] Oracle_Database in N: N (n = 916, err = 4.3%)
| | | [12] Oracle_Database in Y
| | | | [13] SDLC in N: N (n = 19, err = 10.5%)
| | | | [14] SDLC in Y: Y (n = 52, err = 1.9%)
| [15] Hyperion in Y
| | [16] Shatin_Area in N
| | | [17] Central in N: N (n = 442, err = 4.8%)
| | | [18] Central in Y
| | | | [19] database in N: N (n = 46, err = 17.4%)
| | | | [20] database in Y: Y (n = 25, err = 20.0%)
| | [21] Shatin_Area in Y: Y (n = 18, err = 0.0%)
Number of inner nodes: 10
Number of terminal nodes: 11
Created by Mr. Cyrus Wong, Data Scientist.
For update, please join the IVE - Information Technology Facebook page.
For technical explanation, please join the Report Facebook page.
For discussion, please join my facebook group or linkedin me.
Sponsored by:
![]()


supported by AWS in Education Grant award