Social Network Graph Analysis for keyword - Shatin_Area
Back to Report
Terms Matrix for Top 10 Positive Correlated Keyword
Dowload Results
| Shatin_Area | android | Doctor | Full_Time | iOS | PostgreSQL | Degree | ECM | Mobile_Website | BI | Testing | SharePoint | CSS | OLAP | Debugging | NAS |
| Shatin_Area |
2738 |
316 |
46 |
1003 |
291 |
39 |
1957 |
67 |
31 |
229 |
740 |
176 |
175 |
48 |
129 |
51 |
| android |
316 |
6737 |
16 |
1734 |
4781 |
0 |
4299 |
27 |
82 |
127 |
1851 |
97 |
347 |
27 |
261 |
50 |
| Doctor |
46 |
16 |
280 |
68 |
15 |
0 |
210 |
0 |
0 |
5 |
87 |
1 |
4 |
0 |
15 |
0 |
| Full_Time |
1003 |
1734 |
68 |
41278 |
2015 |
35 |
26058 |
216 |
49 |
1303 |
7212 |
838 |
905 |
177 |
566 |
158 |
| iOS |
291 |
4781 |
15 |
2015 |
7445 |
0 |
4704 |
32 |
89 |
139 |
2030 |
94 |
352 |
29 |
253 |
49 |
| PostgreSQL |
39 |
0 |
0 |
35 |
0 |
266 |
209 |
0 |
0 |
1 |
53 |
0 |
66 |
0 |
20 |
6 |
| Degree |
1957 |
4299 |
210 |
26058 |
4704 |
209 |
105752 |
664 |
116 |
4695 |
21492 |
2966 |
2387 |
469 |
1906 |
474 |
| ECM |
67 |
27 |
0 |
216 |
32 |
0 |
664 |
771 |
0 |
78 |
109 |
112 |
1 |
5 |
8 |
0 |
| Mobile_Website |
31 |
82 |
0 |
49 |
89 |
0 |
116 |
0 |
202 |
3 |
10 |
0 |
37 |
0 |
1 |
0 |
| BI |
229 |
127 |
5 |
1303 |
139 |
1 |
4695 |
78 |
3 |
5819 |
1361 |
586 |
72 |
218 |
52 |
18 |
| Testing |
740 |
1851 |
87 |
7212 |
2030 |
53 |
21492 |
109 |
10 |
1361 |
30576 |
860 |
831 |
193 |
1156 |
127 |
| SharePoint |
176 |
97 |
1 |
838 |
94 |
0 |
2966 |
112 |
0 |
586 |
860 |
4088 |
93 |
51 |
44 |
66 |
| CSS |
175 |
347 |
4 |
905 |
352 |
66 |
2387 |
1 |
37 |
72 |
831 |
93 |
4292 |
6 |
154 |
0 |
| OLAP |
48 |
27 |
0 |
177 |
29 |
0 |
469 |
5 |
0 |
218 |
193 |
51 |
6 |
534 |
5 |
0 |
| Debugging |
129 |
261 |
15 |
566 |
253 |
20 |
1906 |
8 |
1 |
52 |
1156 |
44 |
154 |
5 |
2718 |
51 |
| NAS |
51 |
50 |
0 |
158 |
49 |
6 |
474 |
0 |
0 |
18 |
127 |
66 |
0 |
0 |
51 |
607 |
|
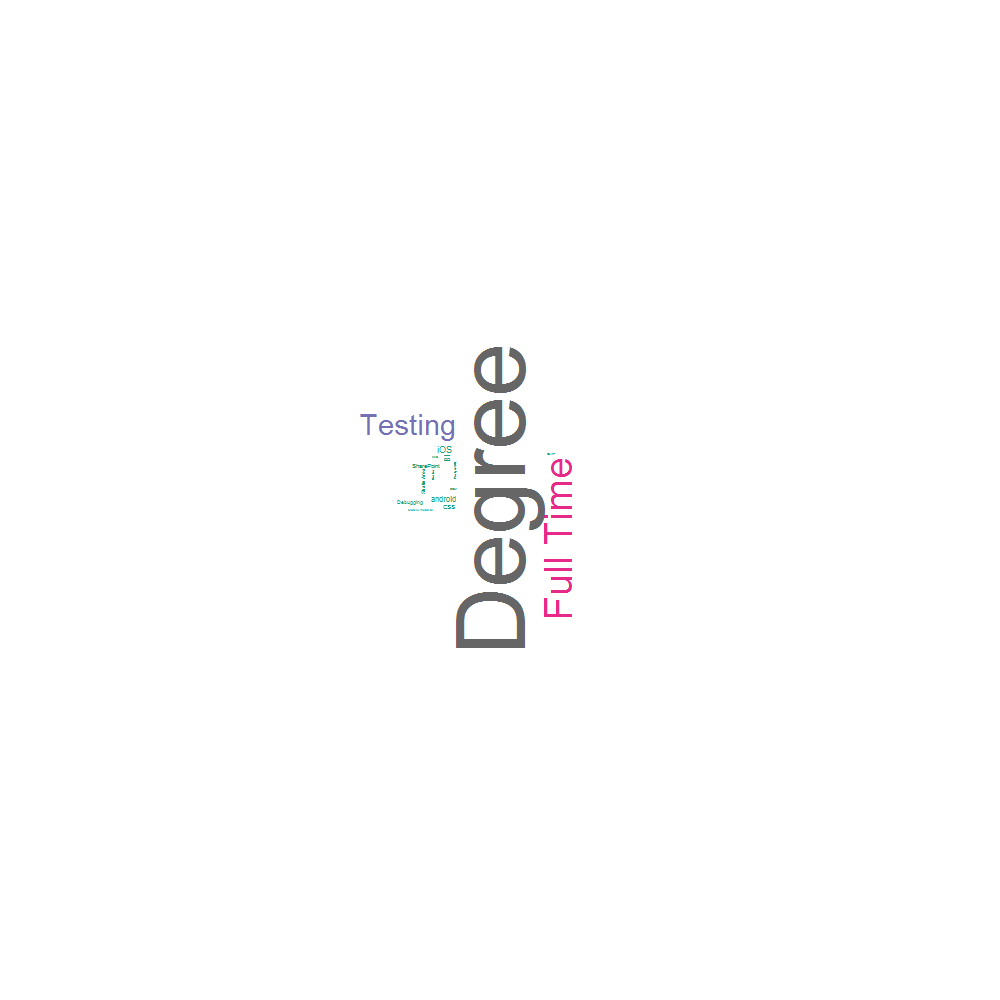
Word Cloud
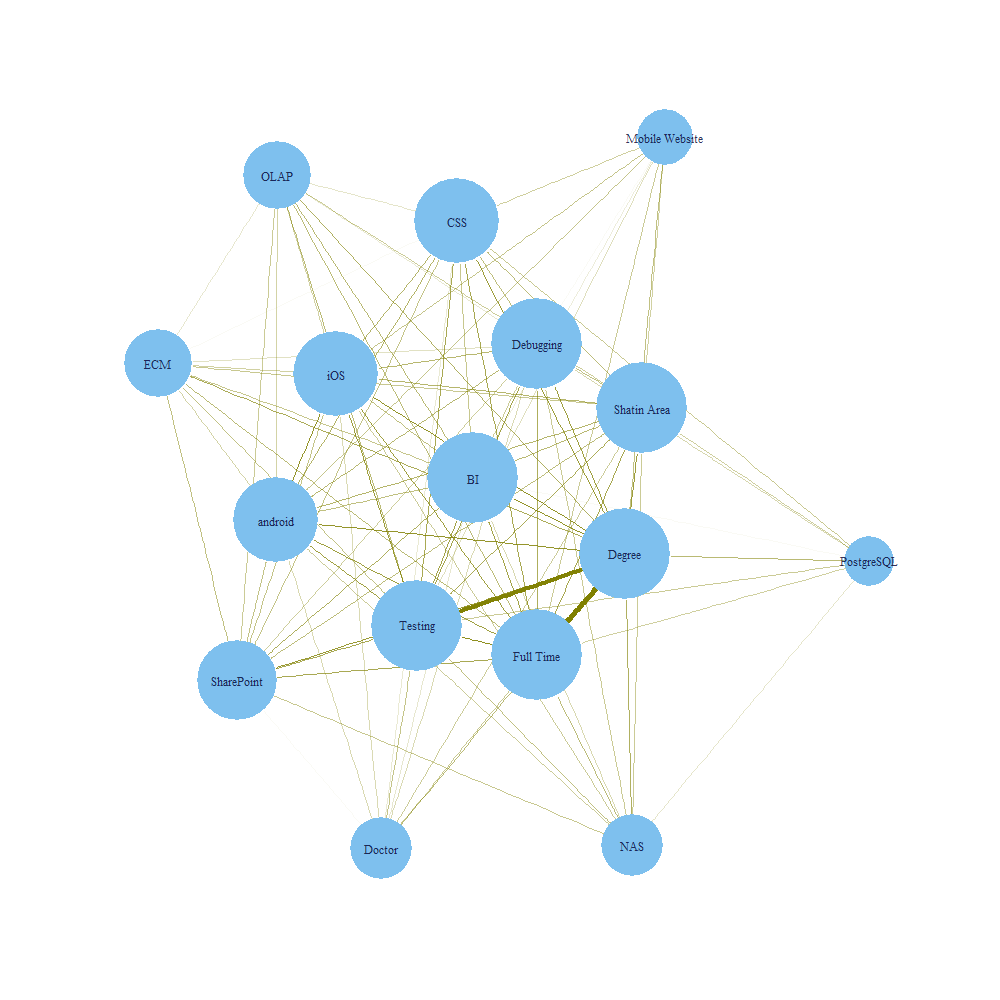
2D Network
The size of node represents the occurrence frequency of the keyword, and the link size or color represents the co-occurrence of the keyword pair.
3D Network
The size of node represents the occurrence frequency of the keyword, and the link size or color represents the co-occurrence of the keyword pair.
Drag it to rotate, and scroll mouse wheel to zoom!
Created by Mr. Cyrus Wong, Data Scientist.
For update, please join the IVE - Information Technology Facebook page.
For technical explanation, please join the Report Facebook page.
For discussion, please join my facebook group or linkedin me.
Sponsored by:


supported by AWS in Education Grant award